
The mechanism of color vision
 المؤلف:
Richard Feynman, Robert Leighton and Matthew Sands
المؤلف:
Richard Feynman, Robert Leighton and Matthew Sands
 المصدر:
The Feynman Lectures on Physics
المصدر:
The Feynman Lectures on Physics
 الجزء والصفحة:
Volume I, Chapter 35
الجزء والصفحة:
Volume I, Chapter 35
 2024-03-30
 1795
1795
Why do colors behave in this way? The simplest theory, proposed by Young and Helmholtz, supposes that in the eye there are three different pigments which receive the light and that these have different absorption spectra, so that one pigment absorbs strongly, say, in the red, another absorbs strongly in the blue, another absorbs in the green. Then when we shine a light on them, we will get different amounts of absorptions in the three regions, and these three pieces of information are somehow maneuvered in the brain or in the eye, or somewhere, to decide what the color is. It is easy to demonstrate that all of the rules of color mixing would be a consequence of this proposition. There has been considerable debate about the thing because the next problem, of course, is to find the absorption characteristics of each of the three pigments. It turns out, unfortunately, that because we can transform the color coordinates in any manner we want to, we can only find all kinds of linear combinations of absorption curves by the color-mixing experiments, but not the curves for the individual pigments. People have tried in various ways to obtain a specific curve which does describe some particular physical property of the eye. One such curve is called a brightness curve. In this figure are two curves, one for eyes in the dark, the other for eyes in the light; the latter is the cone brightness curve. This is measured by finding what is the smallest amount of colored light we need in order to be able to just see it. This measures how sensitive the eye is in different spectral regions. There is another very interesting way to measure this. If we take two colors and make them appear in an area, by flickering back and forth from one to the other, we see a flicker if the frequency is too low. However, as the frequency increases, the flicker will ultimately disappear at a certain frequency that depends on the brightness of the light, let us say at 16 repetitions per second. Now if we adjust the brightness or the intensity of one color against the other, there comes an intensity where the flicker at 16 cycles disappears. To get flicker with the brightness so adjusted, we have to go to a much lower frequency in order to see a flicker of the color. So, we get what we call a flicker of the brightness at a higher frequency and, at a lower frequency, a flicker of the color. It is possible to match two colors for “equal brightness” by this flicker technique. The results are almost, but not exactly, the same as those obtained by measuring the threshold sensitivity of the eye for seeing weak light by the cones. Most workers use the flicker system as a definition of the brightness curve.
Now, if there are three color-sensitive pigments in the eye, the problem is to determine the shape of the absorption spectrum of each one. How? We know there are people who are color blind—eight percent of the male population, and one-half of one percent of the female population. Most of the people who are color blind or abnormal in color vision have a different degree of sensitivity than others to a variation of color, but they still need three colors to match. However, there are some who are called dichromats, for whom any color can be matched using only two primary colors. The obvious suggestion, then, is to say that they are missing one of the three pigments. If we can find three kinds of color-blind dichromats who have different color-mixing rules, one kind should be missing the red, another the green, and another the blue pigmentation. By measuring all these types, we can determine the three curves! It turns out that there are three types of dichromatic color blindness; there are two common types and a third very rare type, and from these three it has been possible to deduce the pigment absorption spectra.
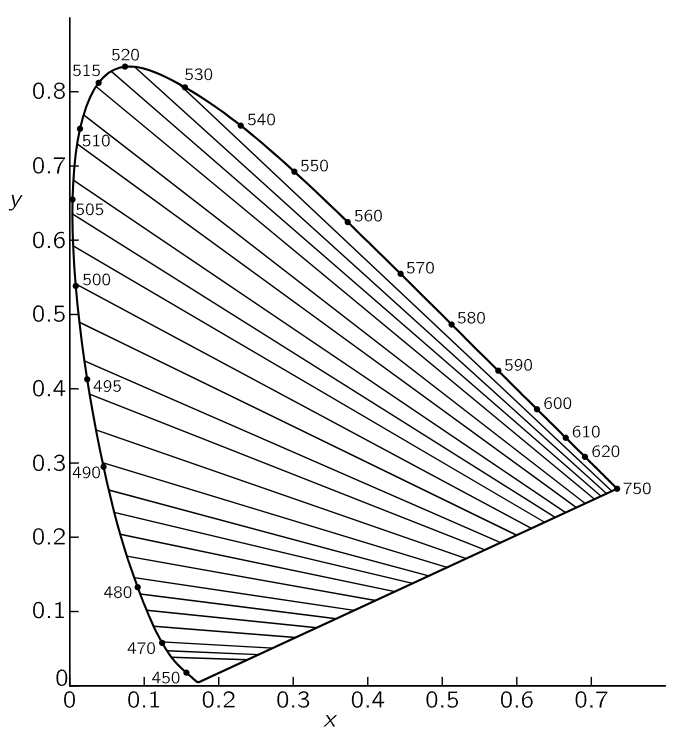
Fig. 35–6. Loci of colors confused by deuteranopes.
Figure 35–6 shows the color mixing of a particular type of color-blind person called a deuteranope. For him, the loci of constant colors are not points, but certain lines, along each of which the color appears to him to be the same. If the theory that he is missing one of the three pieces of information is right, all these lines should intersect at a point. If we carefully measure on this graph, they do intersect perfectly. Obviously, therefore, this has been made by a mathematician and does not represent real data! As a matter of fact, if we look at the latest paper with real data, it turns out that in the graph of Fig. 35–6, the point of focus of all the lines is not exactly at the right place. Using the lines in the above figure, we cannot find reasonable spectra; we need negative and positive absorptions in different regions. But using the new data of Yustova, it turns out that each of the absorption curves is everywhere positive.
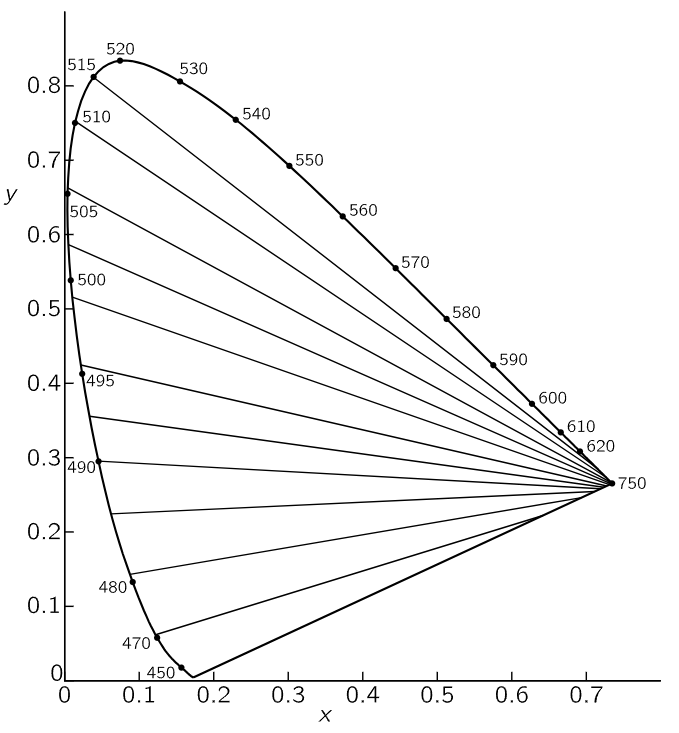
Fig. 35–7. Loci of colors confused by protanopes.
Figure 35–7 shows a different kind of color blindness, that of the protanope, which has a focus near the red end of the boundary curve. Yustova gets approximately the same position in this case. Using the three different kinds of color blindness, the three pigment response curves have finally been determined, and are shown in Fig. 35–8. Finally? Perhaps. There is a question as to whether the three-pigment idea is right, whether color blindness results from lack of one pigment, and even whether the color-mix data on color blindness are right. Different workers get different results. This field is still very much under development.
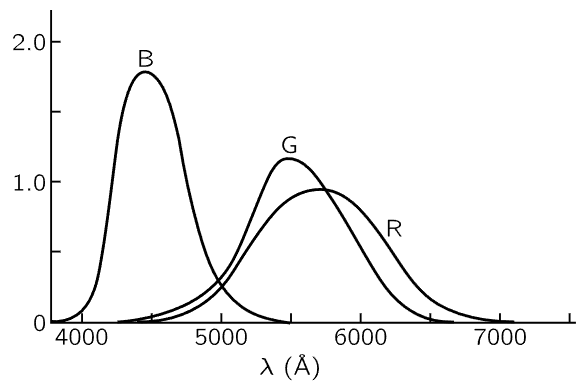
Fig. 35–8. The spectral sensitivity curves of a normal trichromat’s receptors.
 الاكثر قراءة في مواضيع عامة في علم البصريات
 اخر الاخبار
اخبار العتبة العباسية المقدسة


