الوضع الليلي


علم الكيمياء

تاريخ الكيمياء والعلماء المشاهير
التحاضير والتجارب الكيميائية
المخاطر والوقاية في الكيمياء
اخرى
مقالات متنوعة في علم الكيمياء
كيمياء عامة
الكيمياء التحليلية
مواضيع عامة في الكيمياء التحليلية
التحليل النوعي والكمي
التحليل الآلي (الطيفي)
طرق الفصل والتنقية
الكيمياء الحياتية
مواضيع عامة في الكيمياء الحياتية
الكاربوهيدرات
الاحماض الامينية والبروتينات
الانزيمات
الدهون
الاحماض النووية
الفيتامينات والمرافقات الانزيمية
الهرمونات
الكيمياء العضوية
مواضيع عامة في الكيمياء العضوية
الهايدروكاربونات
المركبات الوسطية وميكانيكيات التفاعلات العضوية
التشخيص العضوي
تجارب وتفاعلات في الكيمياء العضوية
الكيمياء الفيزيائية
مواضيع عامة في الكيمياء الفيزيائية
الكيمياء الحرارية
حركية التفاعلات الكيميائية
الكيمياء الكهربائية
الكيمياء اللاعضوية
مواضيع عامة في الكيمياء اللاعضوية
الجدول الدوري وخواص العناصر
نظريات التآصر الكيميائي
كيمياء العناصر الانتقالية ومركباتها المعقدة
مواضيع اخرى في الكيمياء
كيمياء النانو
الكيمياء السريرية
الكيمياء الطبية والدوائية
كيمياء الاغذية والنواتج الطبيعية
الكيمياء الجنائية
الكيمياء الصناعية
البترو كيمياويات
الكيمياء الخضراء
كيمياء البيئة
كيمياء البوليمرات
مواضيع عامة في الكيمياء الصناعية
الكيمياء الاشعاعية والنووية

The Population Standard Deviation σ
 المؤلف:
D. A. Skoog, F. J.Holler, D M. West, and S. R. Crouch
المؤلف:
D. A. Skoog, F. J.Holler, D M. West, and S. R. Crouch
 المصدر:
Fundamentals of Analytical Chemistry
المصدر:
Fundamentals of Analytical Chemistry
 الجزء والصفحة:
9th. p 100
الجزء والصفحة:
9th. p 100
 26-4-2017
 2397
2397


The Population Standard Deviation σ
The population standard deviation σ, which is a measure of the precision of the population, is given by the equation
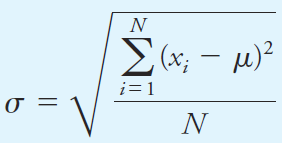
where N is the number of data points making up the population. The two curves in Figure 1.1a are for two populations of data that differ only in their standard deviations. The standard deviation for the data set yielding the broader but lower curve B is twice that for the measurements yielding curve A. The breadth of these curves is a measure of the precision of the two sets of data. Thus, the precision of the data set leading to curve A is twice as good as that of the data set represented by curve B. Figure 1.1b shows another type of normal error curve in which the x axis is now a new variable z, which is defined as
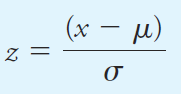
Note that z is the relative deviation of a data point from the mean, that is, the deviation relative to the standard deviation. Hence, when x - μ = σ, z is equal to one; when x - μ = 2σ, z is equal to two; and so forth. Since z is the deviation from the mean relative to the standard deviation, a plot of relative frequency versus z yields a single Gaussian curve that describes all populations of data regardless of standard deviation. Thus, Figure 1.1b is the normal error curve for both sets of data used to plot curves A and B in Figure 1.1a. The equation for the Gaussian error curve is
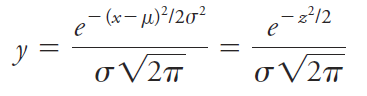
Because it appears in the Gaussian error curve expression, the square of the standard deviation σ2 is also important. This quantity is called the variance A normal error curve has several general properties: (a) The mean occurs at the central point of maximum frequency, (b) there is a symmetrical distribution of positive and negative deviations about the maximum, and (c) there is an exponential decrease in frequency as the magnitude of the deviations increases. Thus, small uncertainties are observed much more often than very large ones.
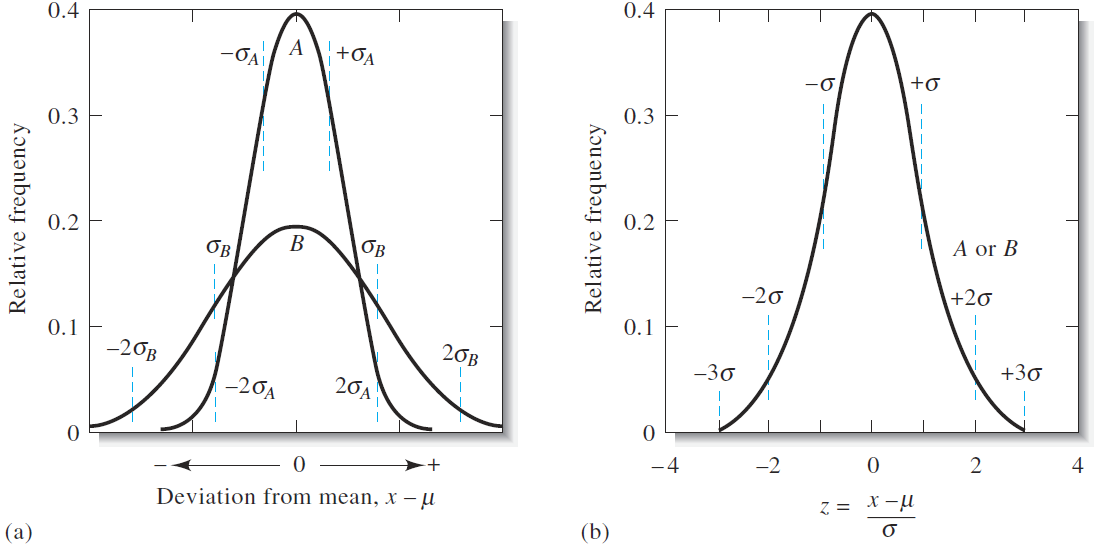
Figure 1.1 Normal error curves. The standard deviation for curve B is twice that for curve A, that is, σB = 2σA. In (a) the abscissa is the deviation from the mean (x – μ) in the units of measurement. In (b) the abscissa is the deviation from the mean in units of s. For this plot, the two curves A and B are identical.


 قسم الشؤون الفكرية يصدر مجموعة قصصية بعنوان (قلوب بلا مأوى)
 قسم الشؤون الفكرية يصدر مجموعة قصصية بعنوان (قلوب بلا مأوى)
 قسم الشؤون الفكرية يصدر كتاب (سر الرضا) ضمن سلسلة (نمط الحياة)