الوضع الليلي


علم الكيمياء

تاريخ الكيمياء والعلماء المشاهير
التحاضير والتجارب الكيميائية
المخاطر والوقاية في الكيمياء
اخرى
مقالات متنوعة في علم الكيمياء
كيمياء عامة
الكيمياء التحليلية
مواضيع عامة في الكيمياء التحليلية
التحليل النوعي والكمي
التحليل الآلي (الطيفي)
طرق الفصل والتنقية
الكيمياء الحياتية
مواضيع عامة في الكيمياء الحياتية
الكاربوهيدرات
الاحماض الامينية والبروتينات
الانزيمات
الدهون
الاحماض النووية
الفيتامينات والمرافقات الانزيمية
الهرمونات
الكيمياء العضوية
مواضيع عامة في الكيمياء العضوية
الهايدروكاربونات
المركبات الوسطية وميكانيكيات التفاعلات العضوية
التشخيص العضوي
تجارب وتفاعلات في الكيمياء العضوية
الكيمياء الفيزيائية
مواضيع عامة في الكيمياء الفيزيائية
الكيمياء الحرارية
حركية التفاعلات الكيميائية
الكيمياء الكهربائية
الكيمياء اللاعضوية
مواضيع عامة في الكيمياء اللاعضوية
الجدول الدوري وخواص العناصر
نظريات التآصر الكيميائي
كيمياء العناصر الانتقالية ومركباتها المعقدة
مواضيع اخرى في الكيمياء
كيمياء النانو
الكيمياء السريرية
الكيمياء الطبية والدوائية
كيمياء الاغذية والنواتج الطبيعية
الكيمياء الجنائية
الكيمياء الصناعية
البترو كيمياويات
الكيمياء الخضراء
كيمياء البيئة
كيمياء البوليمرات
مواضيع عامة في الكيمياء الصناعية
الكيمياء الاشعاعية والنووية

Standard Error of the Mean
 المؤلف:
D. A. Skoog, F. J.Holler, D M. West, and S. R. Crouch
المؤلف:
D. A. Skoog, F. J.Holler, D M. West, and S. R. Crouch
 المصدر:
Fundamentals of Analytical Chemistry
المصدر:
Fundamentals of Analytical Chemistry
 الجزء والصفحة:
9th. p 105
الجزء والصفحة:
9th. p 105
 27-4-2017
 1981
1981


Standard Error of the Mean
The probability figures for the Gaussian distribution calculated as areas refer to the probable error for a single measurement. Thus, it is 95.4% probable that a single result from a population will lie within ±2σ of the mean m. If a series of replicate results, each containing N measurements, are taken randomly from a population of results, the mean of each set will show less and less scatter as N increases. The standard deviation of each mean is known as the standard error of the mean and is given the symbol sm. The standard error is inversely proportional to the square root of the number of data points N used to calculate the mean as given by Equation 1.1.
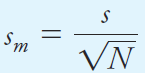 (1.1)
(1.1)
Equation 1.1 tells us that the mean of four measurements is more precise by √4 = 2 than individual measurements in the data set. For this reason, averaging results is often used to improve precision. However, the improvement to be gained by averaging is somewhat limited because of the square root dependence on N shown in Equation 1.1. For example, to increase the precision by a factor of 10 requires 100 times as many measurements. It is better, if possible, to decrease s than to keep averaging more results since sm is directly proportional to s but only inversely proportional to the square root of N. The standard deviation can sometimes be decreased by being more precise in individual operations, by changing the procedure, and by using more precise measurement tools.


 قسم الشؤون الفكرية يصدر مجموعة قصصية بعنوان (قلوب بلا مأوى)
 قسم الشؤون الفكرية يصدر مجموعة قصصية بعنوان (قلوب بلا مأوى)
 قسم الشؤون الفكرية يصدر كتاب (سر الرضا) ضمن سلسلة (نمط الحياة)