علم الكيمياء

تاريخ الكيمياء والعلماء المشاهير
التحاضير والتجارب الكيميائية
المخاطر والوقاية في الكيمياء
اخرى
مقالات متنوعة في علم الكيمياء
كيمياء عامة
الكيمياء التحليلية
مواضيع عامة في الكيمياء التحليلية
التحليل النوعي والكمي
التحليل الآلي (الطيفي)
طرق الفصل والتنقية
الكيمياء الحياتية
مواضيع عامة في الكيمياء الحياتية
الكاربوهيدرات
الاحماض الامينية والبروتينات
الانزيمات
الدهون
الاحماض النووية
الفيتامينات والمرافقات الانزيمية
الهرمونات
الكيمياء العضوية
مواضيع عامة في الكيمياء العضوية
الهايدروكاربونات
المركبات الوسطية وميكانيكيات التفاعلات العضوية
التشخيص العضوي
تجارب وتفاعلات في الكيمياء العضوية
الكيمياء الفيزيائية
مواضيع عامة في الكيمياء الفيزيائية
الكيمياء الحرارية
حركية التفاعلات الكيميائية
الكيمياء الكهربائية
الكيمياء اللاعضوية
مواضيع عامة في الكيمياء اللاعضوية
الجدول الدوري وخواص العناصر
نظريات التآصر الكيميائي
كيمياء العناصر الانتقالية ومركباتها المعقدة
مواضيع اخرى في الكيمياء
كيمياء النانو
الكيمياء السريرية
الكيمياء الطبية والدوائية
كيمياء الاغذية والنواتج الطبيعية
الكيمياء الجنائية
الكيمياء الصناعية
البترو كيمياويات
الكيمياء الخضراء
كيمياء البيئة
كيمياء البوليمرات
مواضيع عامة في الكيمياء الصناعية
الكيمياء التناسقية
الكيمياء الاشعاعية والنووية

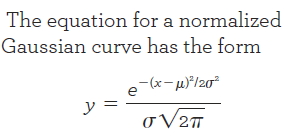
Properties of Gaussian Curves
 المؤلف:
D. A. Skoog, F. J.Holler, D M. West, and S. R. Crouch
المؤلف:
D. A. Skoog, F. J.Holler, D M. West, and S. R. Crouch
 المصدر:
Fundamentals of Analytical Chemistry
المصدر:
Fundamentals of Analytical Chemistry
 الجزء والصفحة:
9th. p 99
الجزء والصفحة:
9th. p 99
 26-4-2017
 2387
2387


+
-
20
Properties of Gaussian Curves
Figure 1.1 shows two Gaussian curves in which we plot the relative frequency y of various deviations from the mean versus the deviation from the mean.
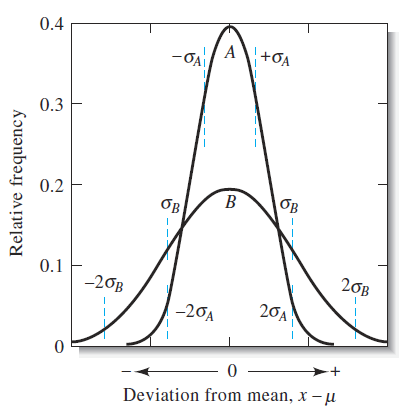
Figure 1.1 Normal error curves. The standard deviation for curve B is twice that for curve A, that is, σB = 2σA. In (a) the abscissa is the deviation from the mean (x – m) in the units of measurement.
As shown in curves such as these can be described by an equation that contains just two parameters, the population mean μ and the population standard deviation σ.
The term parameter refers to quantities such as μ and σ that define a population or distribution. Data values such as x are variables. The term statistic refers to an estimate of a parameter that is made from a sample of data as discussed below. The sample mean and the sample standard deviation are examples of statistics that estimate parameters m and s respectively.
 الاكثر قراءة في مواضيع عامة في الكيمياء التحليلية
 اخر الاخبار
اخبار العتبة العباسية المقدسة

الآخبار الصحية


مواضيع ذات صلة
 قسم الشؤون الفكرية يصدر كتاباً يوثق تاريخ السدانة في العتبة العباسية المقدسة
 "المهمة".. إصدار قصصي يوثّق القصص الفائزة في مسابقة فتوى الدفاع المقدسة للقصة القصيرة
 (نوافذ).. إصدار أدبي يوثق القصص الفائزة في مسابقة الإمام العسكري (عليه السلام)